Testing Hypotheses
Random Samples and Sample Means
The logic of statistical hypothesis testing is a bit different from probability theory. First off, in hypothesis testing, we evaluate a large dataset, or statistical population, based on samples.
You don't need to analyze the entire dataset. All you need is a small but representative portion of the data that reflects the features of the population as a whole. The easiest way to do this is to take a random sample.
If some datasets have several parts of unequal size that differ greatly with respect to the parameter you're studying then it's a good idea to take proportional random samples of each part and then combine them. The result is a stratified sample that's more representative than a regular random sample would be. We call it "stratified" because we divided the population into strata, or groups, that have something in common. With a sample like this you can draw conclusions about the population. It's usually enough to estimate mean values and variance in order to draw a conclusion about equality or inequality with regard to populations' mean values.
We can learn almost anything about the mean and variance of a population based on the calculated sample, if our sample is big enough.
One way to state the central limit theorem goes like this: if there are sufficient observations in a sample, the sampling distribution of the sample mean of any statistical population is normally distributed around the mean of this population. "Any statistical population" means that the statistical population can have any distribution. The mean values of the samples will still be normally distributed around the mean of the entire statistical population.
The measure of the degree to which the sample mean deviates from the mean of the population is called the standard error and is found using this formula:
E.S.E. stands for estimated standard error. It’s "estimated" because we only have a sample. We don’t know the exact error, we just estimate it based on the data we have.
S is the population's estimated standard deviation.
n is the sample size. Since the square root of is in the denominator, the standard error decreases as the sample size increases. So how can we use all of this to formulate hypotheses?
Formulating Hypotheses
No experimentally obtained data will ever confirm any hypothesis. The data can only contradict the hypothesis or, conversely, show that the results are extremely unlikely (assuming that the hypothesis is true). But in both cases we have no grounds to state that the hypothesis has been proven.
If the data doesn't contradict the hypothesis, we simply don't reject it. But if, assuming the hypothesis is true, we'd be highly unlikely to get such data, we have a reason to reject the hypothesis.
Typical hypotheses pertain to the means of statistical populations and look like this:
- The mean of a population equals a certain value.
- The means of two populations are equal to each other.
A test of a statistical hypothesis always begins with a statement of the hypothesis. First, we state the null hypothesis, . Then the alternative hypothesis, , is based on ( is always stated with an equal sign.)
After that we construct a distribution based on the assumption that is true. In this case, it would be a normal distribution around the parameter of interest, the mean. The variance or its square root, the standard deviation (a measure of the distribution's dispersion, or scatter), is estimated based on the sample.
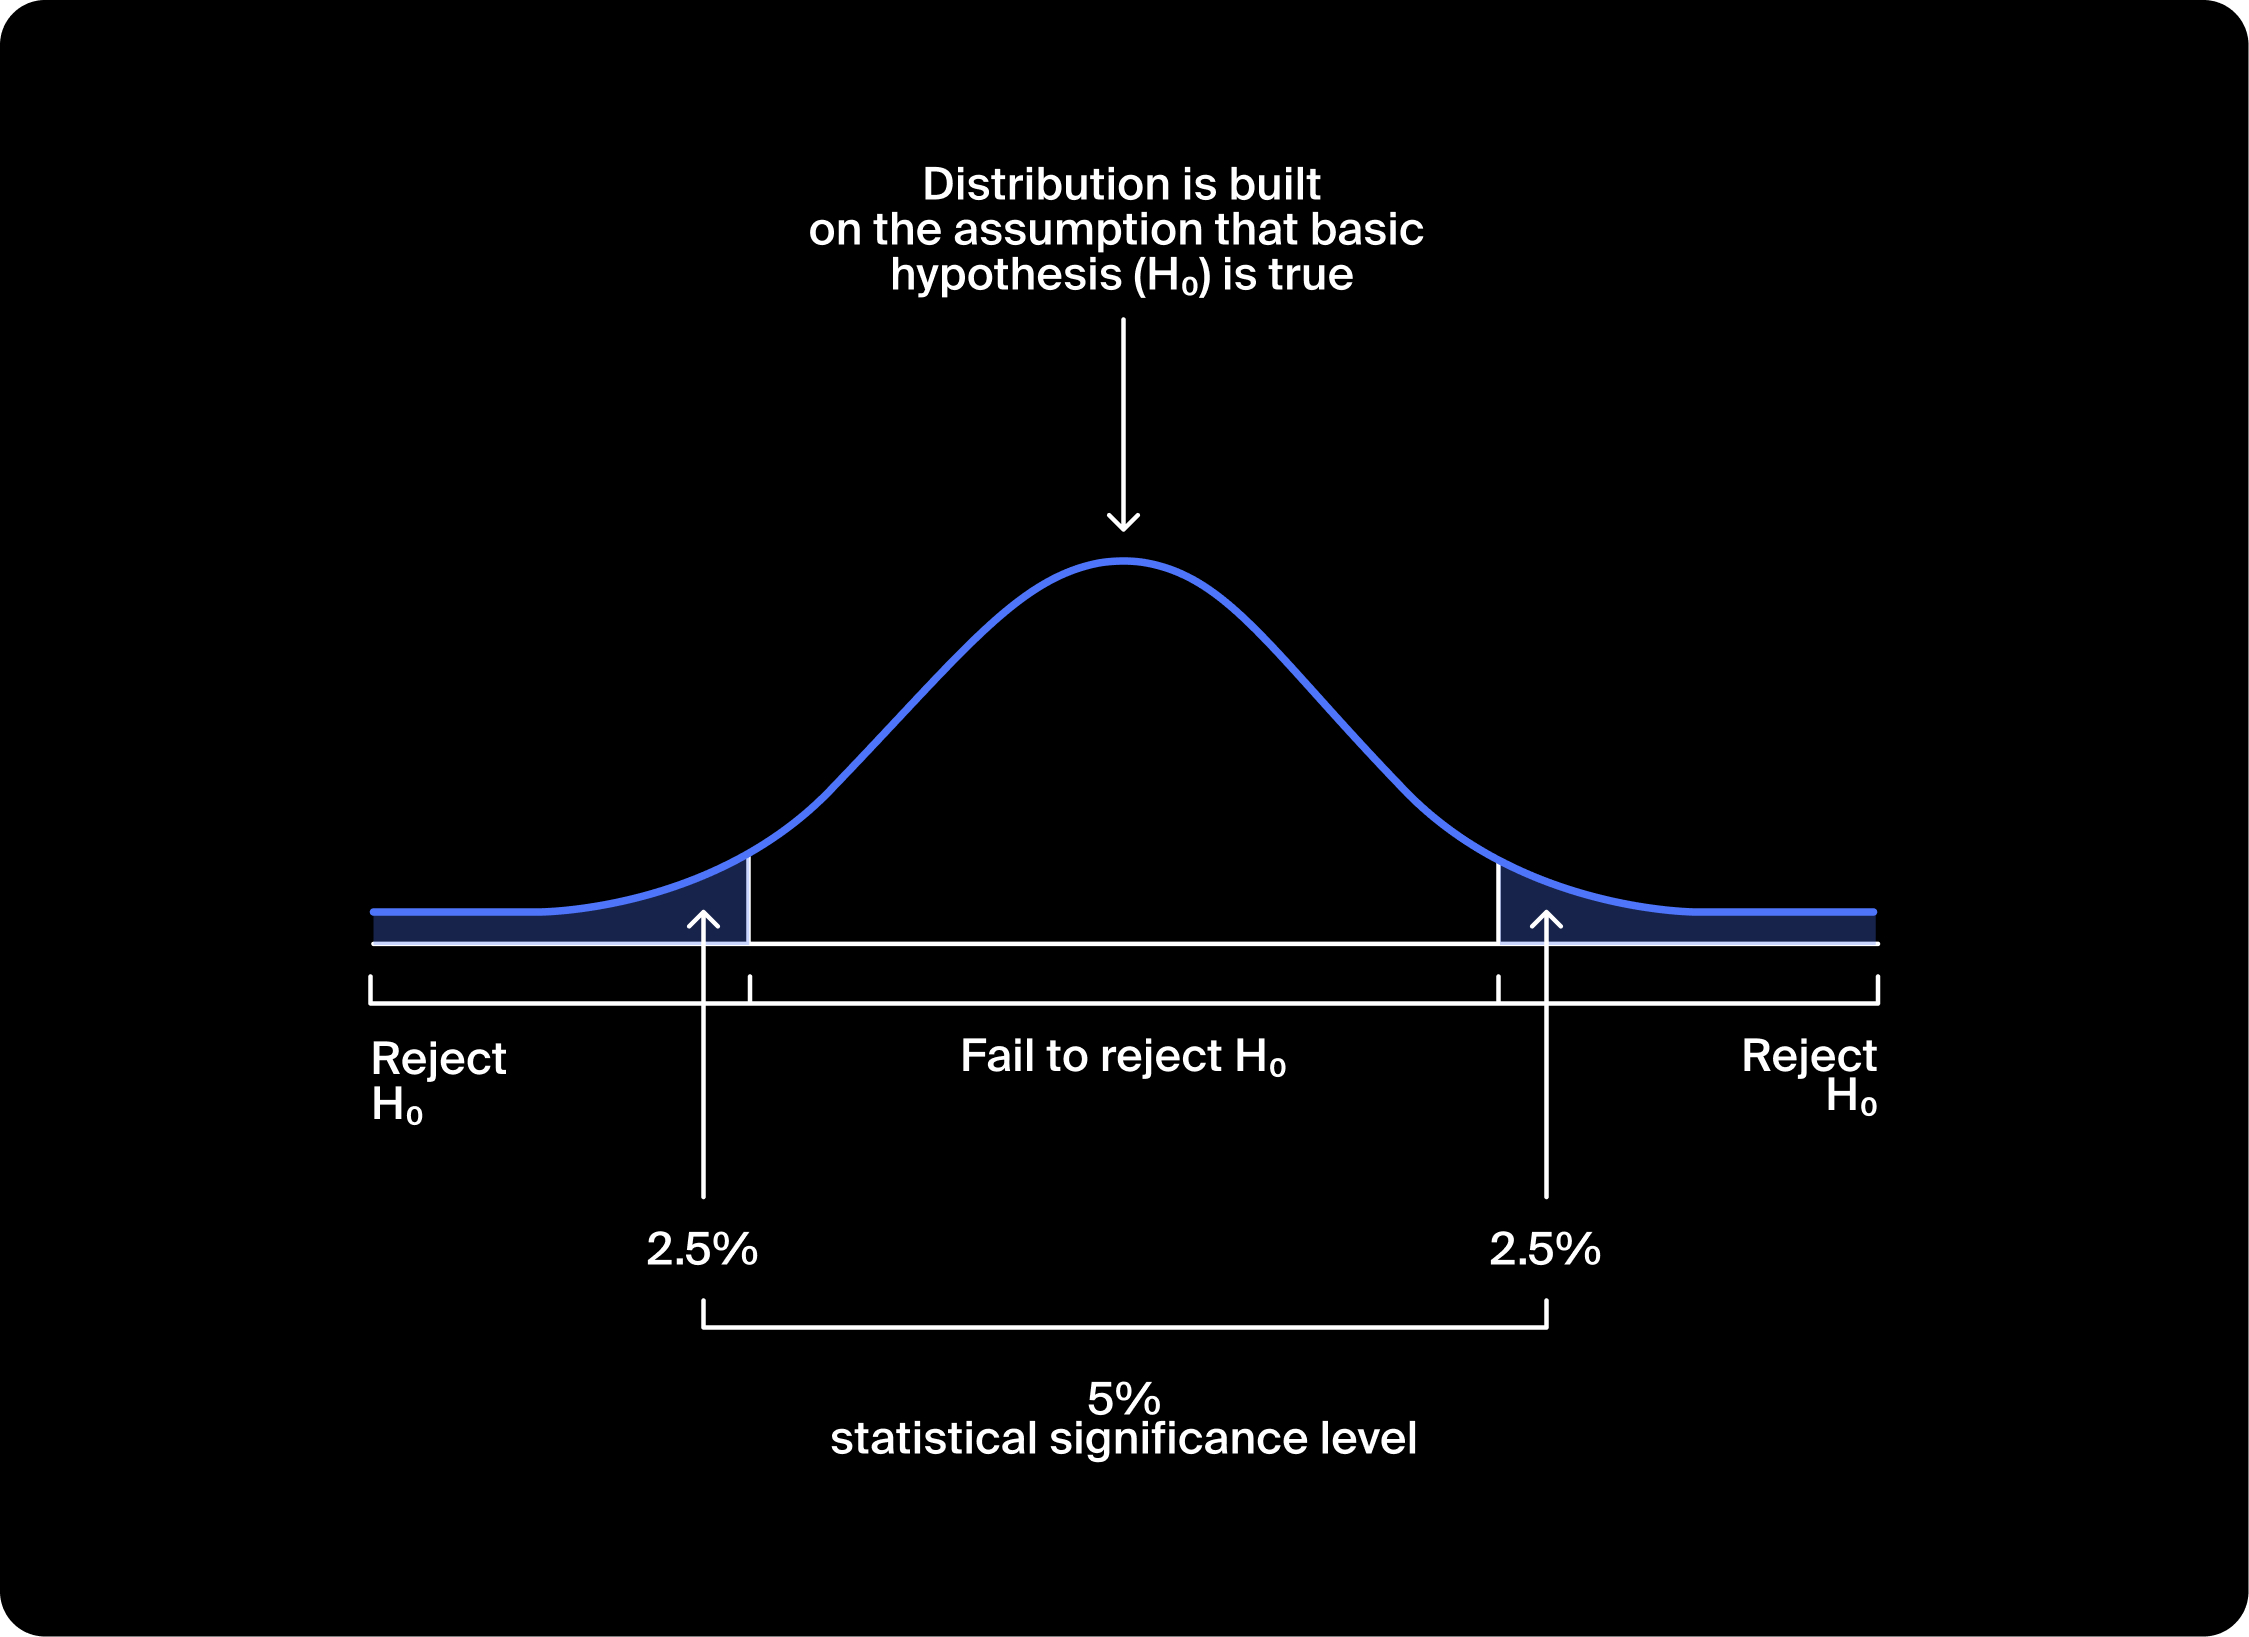
For the normal distribution, the probability of falling in some interval is equal to the area under the curve for that interval. There will be values within a certain range of the mean that we are highly likely to get randomly.
So how can we determine if we need to reject the null hypothesis or not? We specify a critical value for the sample significance level of the hypothesis test. This significance level is the total probability that an empirically measured value will be far from the mean. Let’s say the value observed in the sample falls in this range. If we assume the null hypothesis is correct, then the probability of such an event occurring is judged to be too low (with respect to the significance level). Therefore, we have reason to reject the null hypothesis. When the value falls in the "Don’t reject " range, there are no grounds for rejecting the null hypothesis. We conclude that the empirically obtained data doesn’t refute the null hypothesis.
There is a method in Python that returns the difference statistic between the mean and the value for comparison. The most important is the statistical significance between them, which is the -value.
The difference statistic is the number of standard deviations between compared values, if both distributions are converted to a standard normal distribution with mean 0 and standard deviation 1. However, this value doesn't give you enough information to draw a conclusion about your null hypothesis.
Instead, we use the -value to decide whether to reject the null hypothesis. The -value represents the probability of getting the observed outcome or an outcome further from what would be expected assuming that the null hypothesis is correct. The conventional threshold values are 5% and 1%. It's ultimately up to the analyst to decide which threshold to consider sufficient.
Move the sliders on the interactive below to see the effect of changing the -value.
To test the hypothesis that the mean of a statistical population equals some value, you can use the method scipy.stats.ttest_1samp(). The parameters of the method are array (the array containing the sample) and popmean (the proposed mean we’re using for the test). The method returns the difference statistic between popmean and the sample mean from the array, as well as the significance level:
1from scipy import stats as st23interested_value = 12045results = st.ttest_1samp(6 array,7 interested_value)89print('p-value: ', results.pvalue)
So now we know how to make and test a hypothesis, but what do we do when we need to test the means of two populations?
Hypothesis on the Equality of the Means of Two Populations
There may be times when you need to compare the means of two different statistical populations. In order to test your hypothesis that the means of two statistical populations are equal based on samples taken from them, apply the method scipy.stats.ttest_ind(). The method takes the following parameters:
array1,array2are arrays containing the samples.equal_varis an optional parameter that specifies whether or not the variances of the populations should be considered equal.
If there is reason to believe that the samples were taken from populations with similar parameters, then set equal_var = True, and the variance of each sample will be estimated from the combined dataset from the two samples, not separately from the values in each sample. This gives us more accurate results.
However, we only do this if the variances of the statistical populations from which the samples are taken are approximately equal. Otherwise, we need to set equal_var = False; by default, it's Hypothesis on the Equality of the Means of Paired Samples equal_var = True.
1from scipy import stats as st23sample_1 = [...]4sample_2 = [...]56results = st.ttest_ind(7 sample_1,8 sample_2)910print('p-value: ', results.pvalue)
Now that we know how to compare the means of two different statistical populations, it’s time for us to look at the means of paired samples.
Hypothesis on the Equality of the Means of Paired Samples
When we're working with one statistical population, it’s useful to know if changes have an effect on the population's mean.
A paired sample means that we're measuring a variable of the same entity. In order to test the hypothesis that the means of two statistical populations are equal for dependent (paired) samples. To do this in Python we use the function scipy.stats.ttest_rel():
1from scipy import stats as st23before = [...]4after = [...]56results = st.ttest_rel(7 before,8 after)910print('p-value: ', results.pvalue)